改善他人生活并不需要太多成本
Subscribe Donate Gdoc/Admin HomeForeign Aid
对我们许多人来说,改善他人生活并不需要太多成本,而且我们可以做得更多
大多数国家用于对外援助的国民收入占比不到 1%;即使是小幅增加也能带来巨大的改变。
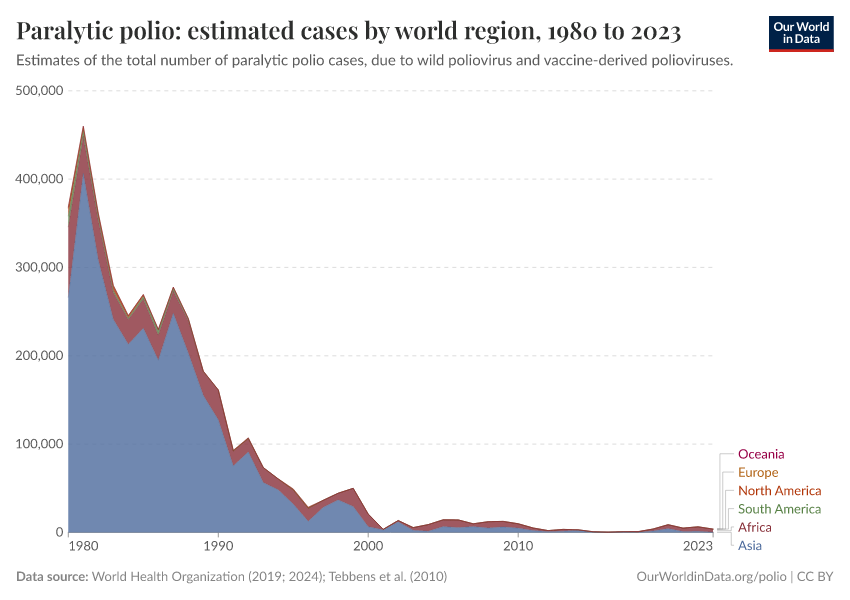
作者:Hannah Ritchie 2025年3月10日 Cite this articleReuse our work freely 在 20 世纪 80 年代初,每年有近 50 万人因脊髓灰质炎而瘫痪。他们大多数是儿童。脊髓灰质炎是一种可怕的疾病,可能在数小时内导致瘫痪,甚至导致窒息和死亡。
但看看下图所示的世界在这一领域取得的进展。病例数从峰值下降了 99% 以上。1
2023 年全年的病例数与 1981 年 两天 的病例数相同。曾经在世界几乎所有国家流行的野生脊髓灰质炎现在仅在阿富汗和巴基斯坦流行。
这改变了数百万儿童的生活轨迹。
对外援助项目在抗击脊髓灰质炎方面发挥了关键作用。1998 年,启动了 Global Polio Eradication Initiative,以确保所有儿童都能接种脊髓灰质炎疫苗。
早在 20 世纪 50 年代,一些用于脊髓灰质炎疫苗研究的资金就来自基层运动和美国个人的小额捐款,以寻找治疗方法(以及诸如 March of Dimes 等更大的组织)。2 到 20 世纪 80 年代后期,一些 G7 政府和更大的慈善捐助者介入以扩大这些努力。下图显示了随着时间推移根除脊髓灰质炎的资金来源;来自外国政府的捐款以红色显示。请注意,来自“多边部门”的一些资金也来自捐助国。

虽然近年来私人捐助者做出了最大的贡献,但在过去几十年中,政府发挥了关键作用。3 特别是在 20 世纪 90 年代末和 21 世纪初,捐助国为这些努力提供了 80% 以上的资金。
这意味着,如果您居住在这些国家/地区中的任何一个并且缴纳税款,那么您就为上图所示的惊人进展做出了贡献。
对于脊髓灰质炎来说是这样,对于其他疾病和像食物这样的基本资源来说也是如此。PEPFAR 计划——由美国在 2003 年在乔治·布什政府领导下启动——据估计已经拯救了超过 2500 万人的生命免受 HIV 的侵害。用于蚊帐和抗疟疾治疗的捐款帮助减少了人们感染和死于疟疾的人数。全球基金和 USAID 已经减少了因肺结核造成的死亡。紧急援助使人们在饥荒和严重的粮食短缺期间得以生存。这样的例子不胜枚举。
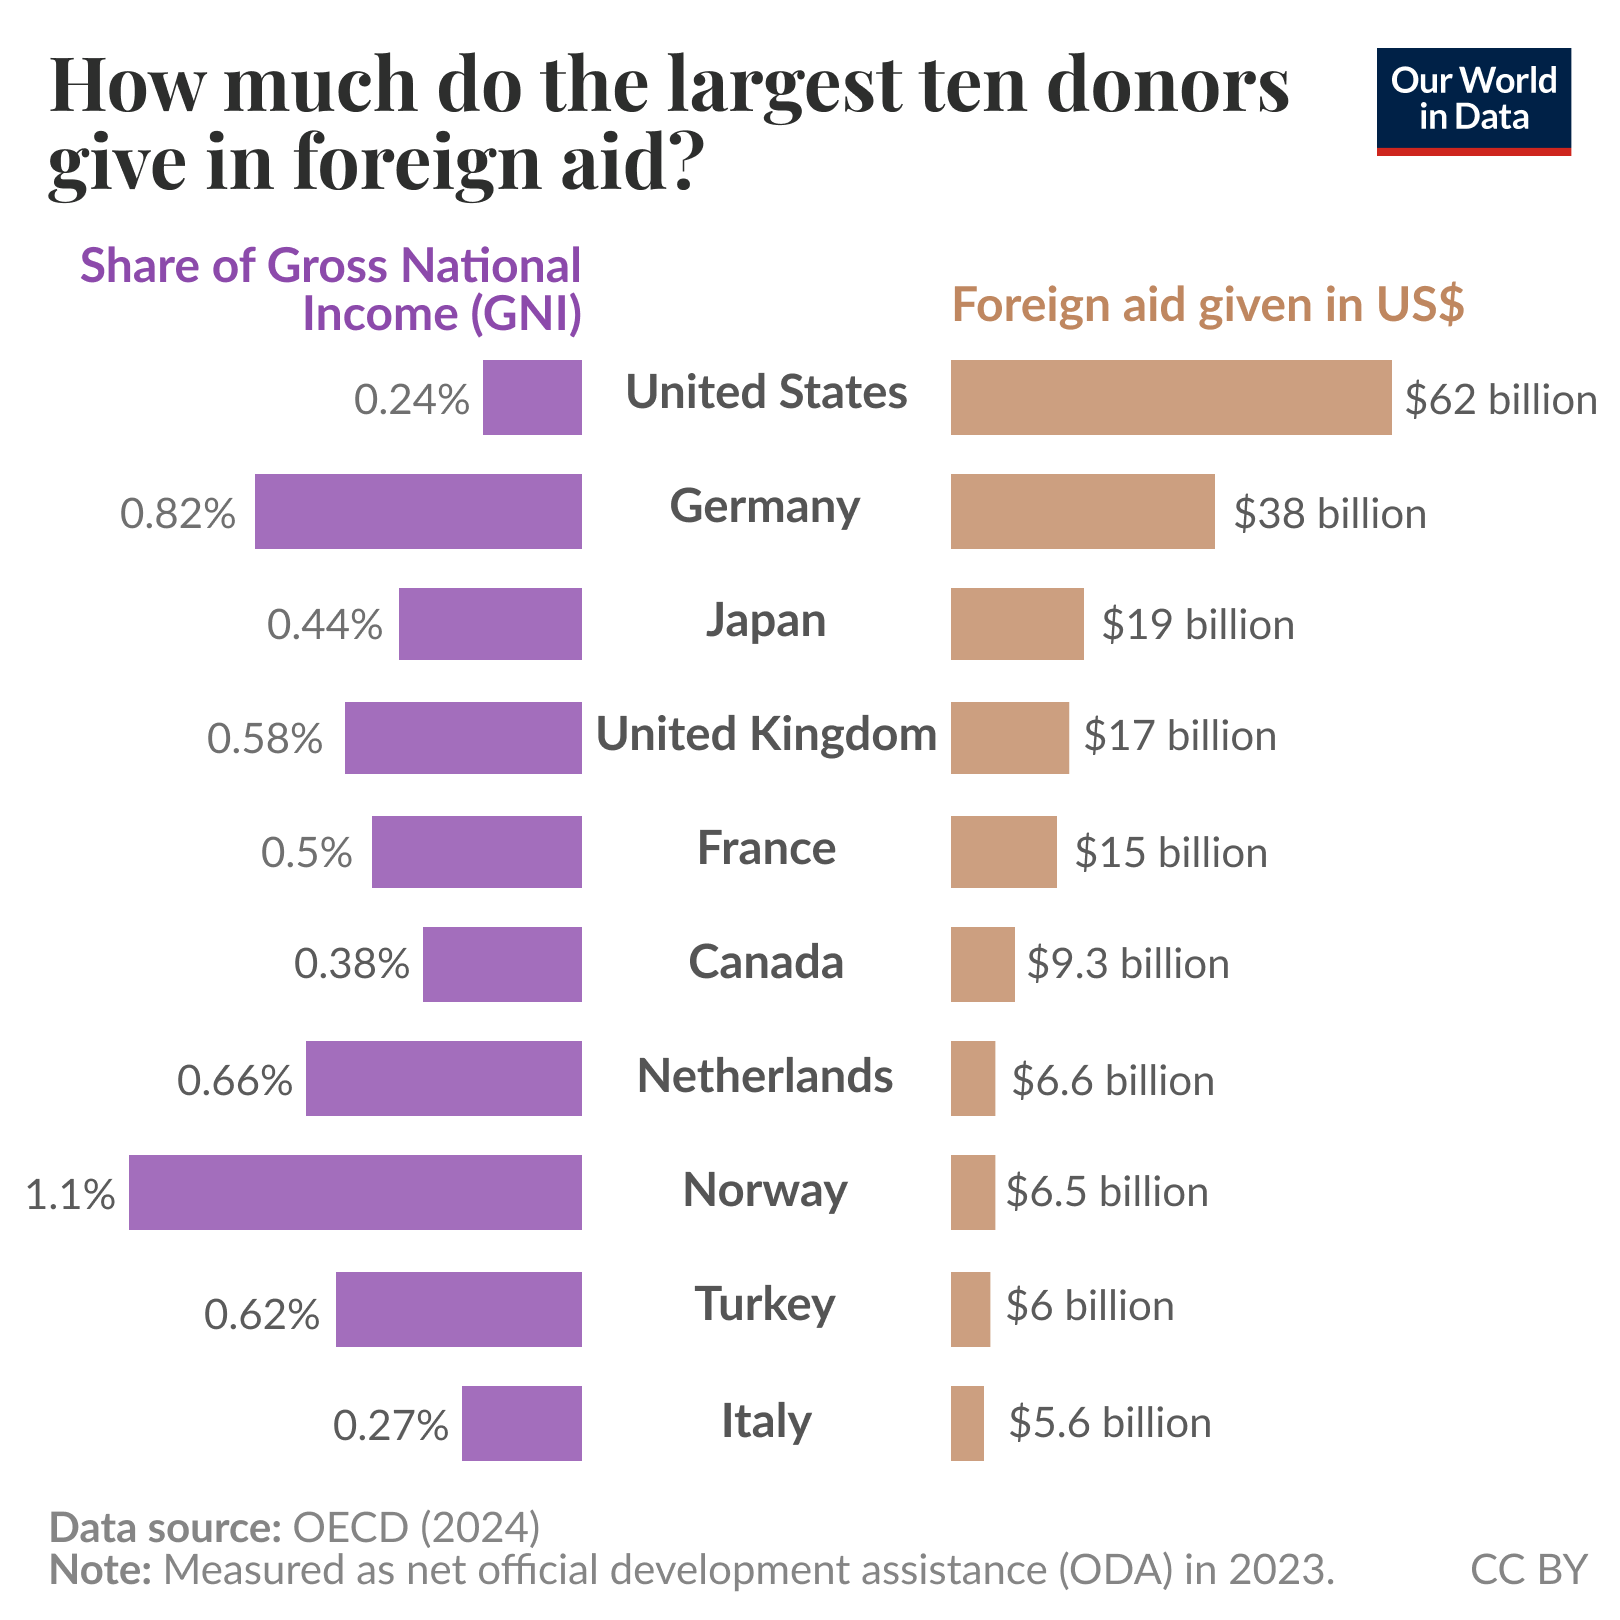
这些成就的取得所用的资金相对较少。2023 年,世界提供了大约 2400 亿美元的对外援助。这在大多数富裕国家的经济中只占很小的比例。以经合组织国家为例,它仅占其国民总收入 (GNI) 的 0.37%。如下图所示,挪威是唯一一个将其 GNI 的 1% 以上用于援助的国家。4
 Download image
作为一名英国公民,我非常乐意将我的税款用于这种用途。我想不出我更愿意贡献什么。
少量资金可以产生巨大影响的一个原因是,在最贫穷的国家,一美元比在最富裕的国家更有价值。我们许多人可能认为理所当然的治疗方法——比如脊髓灰质炎疫苗——通常只需要几美元。一杯外卖咖啡的费用,我们就可以为几个孩子接种疫苗,以预防可能致命的疾病。
世界如何才能实现更多这样的目标?
我觉得我处于一个有利的位置——可以说是有史以来最好的位置之一——以某种方式帮助实现这一目标。一个人机会和结果的最大因素是他们出生地和时间。这是一个随机彩票。我碰巧抽到了一个幸运签,原因有两个。
首先,我出生在一个富裕的国家,英国。其次,我出生在一个时代和环境中,这给了我一些可支配收入和选择如何花钱的自由。
这给了我两种贡献方式。首先,我可以倡导并向我的政府施加压力,要求增加其对外援助支出。其次,我可以为一些在低收入国家最划算的慈善机构做出个人贡献。
如果你和我处境相似——或者至少有其中 一个 选择——那么我们可以做一些事情来产生积极的影响。
大部分援助来自政府,而不是私人慈善捐助者
你可能有一个问题,即世界上的大部分援助来自政府还是私人捐助者,而私人捐助者主要由亿万富翁资助的慈善机构主导。如果是前者,公民可以对全球援助预算产生 一些 影响。如果是后者,则完全超出我们的控制范围。
如下图所示,2023 年,超过 95% 的对外援助来自国家政府。略低于 110 亿美元——或总额的 4.5%——来自私人赠款。5
请注意,这里的私人捐助者仅包括提交给经合组织并符合其发展赠款标准的捐款。这主要来自大型慈善基金会。不要将其与私人发展资金总额混淆,后者可能包括外国投资、移民汇款和其他形式的私人资金转移。
Download image
这意味着两件事。
首先,对援助的支持减少会对全球总额产生巨大影响。让我用一些粗略的计算来说明这一点。
美国在 2023 年提供了 620 亿美元的援助。如果它将其援助预算削减仅 20%,其捐款将减少约 130 亿美元。这相当于取消 全球所有 私人慈善捐款。6
即使是来自较小国家(如我的祖国英国)的资金减少,也会产生重大影响。“Reform UK”,英国的一个右翼政党,在其上次宣言中承诺将对外援助减半。将对外援助减半将使英国的捐款减少 87 亿美元。7 同样,这与所有私人捐助者合计提供的 108 亿美元相差不远——相对而言。
即使在最近,英国首相 确实 宣布到 2027 年削减 60 亿美元的对外援助。这相当于所有私人慈善赠款的一半以上。
第二个含义是,如果我们希望看到全球对外援助增加,那么建立 公众 支持,以便我们的政府提供更慷慨的援助预算非常重要。在下一节中,我将运行一些数字来证明这一点。
对外援助的小幅增加可能会大有帮助
我们可以通过关注联合国为发达国家制定的目标来说明这一点,即将其 GNI 的 0.7% 用于对外援助。8 只有五个国家——挪威、卢森堡、瑞典、德国和丹麦——在 2023 年实现了这一目标。
让我们想象一下,发达国家的公众向其政府施加压力以加强并实现这一目标。如果 所有 发达国家都实现了这一目标,我们将额外增加 2160 亿美元的资金,这意味着全球官方发展援助预算几乎会翻一番。9 如下图所示。请记住:私人捐助者在 2023 年总共捐赠了 110 亿美元,因此这种增加相当于大约 20 倍。
Download image
如果我们更进一步,并假设所有捐助国都像 最 慷慨的国家一样慷慨——正如我们前面看到的,挪威的 GNI 为 1.1%——全球援助预算将增加到大约 7000 亿美元。这意味着我们可以提供目前三倍的脊髓灰质炎疫苗、抗疟疾蚊帐、HIV 治疗和食品包。
同样,重要的是要强调,对于发达经济体而言,这些仍然是相对较少的资金,仅占其国民收入的 0.7% 或 1.1%。
有趣的是,这远低于大多数人 认为 他们国家目前用于对外援助的金额。
很难找到最新的数据,但在 2015 年的一项调查中,美国公民被要求猜测美国联邦支出中有多少用于对外援助。正确的答案略低于 1%。只有 3% 的受访者回答正确。平均 猜测值高达 31%。一项较早的调查发现了类似的结果,平均猜测值为 25%。
这些问题是关于联邦支出的,它与 GNI 不同。美国将其 GNI 的约 0.25% 用于对外援助,但这约占其联邦预算的 1%。
同样有趣的是,当被问及联邦支出中 应该 有多少用于对外援助时,平均答案是 10%。这是目前支出的十倍。
并非所有调查都发现公众认知与现实之间存在如此大的差异,但差距仍然很大。在 2012 年在荷兰进行的一项调查中,平均猜测是 5.6% 的 GDP 用于对外援助。正确的答案是 0.7%。
因此,虽然“对外援助”通常是诸如“政府在哪个部门支出过多?”等问题的最常见答案,但其中一些可能可以用以下事实来解释,即大多数人认为我们在对外援助上的支出远多于实际支出。
你的个人捐款也能发挥作用,尤其是当你专注于它们能够发挥最大作用的地方
正如我前面所说,向富裕国家/地区的政府施加压力,要求增加对外援助——或投票支持那些会增加对外援助的政党——只是我可以帮助将资金从全球收入分配的顶端转移到低端的一种方式。
我还将我的一些钱直接捐赠给最有效的慈善事业。几年前,我承诺 Giving What We Can,承诺将我至少 10% 的收入捐给慈善机构。我特别关注在一些低收入国家开展的项目,以及少量资金可以发挥很大作用的事业。慈善评估机构 GiveWell 是一个很好的资源,可以找到一些最划算的支持事业。
就个人捐款而言,这种关于成本效益的观点对我来说尤其重要,但当涉及到对外援助时,它也很重要。在本文的开头,我重点介绍了一些成功的援助项目:努力根除脊髓灰质炎,减少因 HIV 和疟疾造成的死亡,以及在饥荒期间提供食品供应。如果所有援助资金都能像这样得到良好的利用,那将是很好的,但事实并非如此。一些对外援助 确实 用于对没有太大影响的项目和活动。超过一半的英国人认为由于腐败,援助完全是浪费,正是这些例子通常会让人们怀疑他们的钱是否得到了很好的利用。
虽然我提倡总体上增加对外援助预算(以及个人捐款),但我也希望看到重新关注确保我们以最佳方式使用这笔钱。这不仅可以改善需要这种支持的人的 结果,还可以增加富裕国家/地区对增加对外援助预算的支持。
当援助项目运作良好时,它们可以改变数百万人的生活。这些项目并非旨在永远持续下去;它们旨在支持低收入国家并启动自我实现的进步。不幸的是,这些进步的故事鲜为人知。如果我们希望看到对对外援助的支持再次兴起,我们需要更多地谈论它们。
Acknowledgments
Many thanks to Max Roser, Edouard Mathieu, Bastian Herre, Simon van Teutem, and Saloni Dattani for their feedback and comments on this article.
Continue reading on Our World in Data
The global fight against polio — how far have we come?A generation ago, polio paralyzed hundreds of thousands of children every year. Many countries have eliminated the disease, and our generation has the chance to eradicate it.
Global Inequality of OpportunityToday’s global inequality of opportunity means that the good or bad luck of where you were born matters most for your living conditions. We look at how this chance factor is the strongest determinant of your standard of living, whether in life expectancy, income, or education.
Foreign AidWho gives and receives foreign aid? Which forms does it take? What are examples of when it was (un-)successful?
Endnotes
- In 1981, there were an estimated 460,000 cases. By 2023, this had fallen to 3800. That’s a reduction of just over 99% [(460,000 - 3800) / 460,000 * 100 = 99.2%].
- Page 188 in Oshinsky, D. (2005). Polio: An American Story (1st ed.). New York: Oxford University Press. Parts are available on Google Books.
- The Gates Foundation and Rotary International have been the largest donors in recent years.
- Funding from most rich countries has been consistently between 0.2% and 1% since the 1960s.
- Not that grant data for some private donors is for 2022, rather than 2023. However, the change from year-to-year is usually small, so it’s unlikely that updated data would be significantly different from $11 billion.
- Private donors gave $10.8 billion collectively in 2023.
- In 2023, the UK gave $17.3 billion in official development assistance.
- This target was adopted by countries at the UN General Assembly in 1970. Most countries accepted the target, except for the United States and Switzerland.
- I’ve calculated this by assuming that all current national donors with contributions below 0.7% increased their aid to that level. The five countries already at or above this maintained their contributions at the same level.
Cite this work
Our articles and data visualizations rely on work from many different people and organizations. When citing this article, please also cite the underlying data sources. This article can be cited as:
Hannah Ritchie (2025) - “For many of us, it doesn’t cost much to improve someone’s life, and we can do much more of it” Published online at OurWorldinData.org. Retrieved from: 'https://ourworldindata.org/foreign-aid-donations-increase' [Online Resource]
BibTeX citation
@article{owid-foreign-aid-donations-increase,
  author = {Hannah Ritchie},
  title = {For many of us, it doesn’t cost much to improve someone’s life, and we can do much more of it},
  journal = {Our World in Data},
  year = {2025},
  note = {https://ourworldindata.org/foreign-aid-donations-increase}
}
![]()
Reuse this work freely
All visualizations, data, and code produced by Our World in Data are completely open access under the Creative Commons BY license. You have the permission to use, distribute, and reproduce these in any medium, provided the source and authors are credited. The data produced by third parties and made available by Our World in Data is subject to the license terms from the original third-party authors. We will always indicate the original source of the data in our documentation, so you should always check the license of any such third-party data before use and redistribution. All of our charts can be embedded in any site.
Our World in Data is free and accessible for everyone.
Help us do this work by making a donation.
Donate now
Our World in Data is a project of Global Change Data Lab, a nonprofit based in the UK (Reg. Charity No. 1186433). Our charts, articles, and data are licensed under CC BY, unless stated otherwise. Tools and software we develop are open source under the MIT license. Third-party materials, including some charts and data, are subject to third-party licenses. See our FAQs for more details.
![]()
![]()
![]()
![]()
Explore
Resources
About
RSS Feeds
Follow us
Subscribe Leave us feedback Have a question? You may find an answer in:General FAQ or Vaccinations FAQ Message Your name Email addressYour name and email will only be used to reply to you and not for any other purpose. If you do not give a valid email, we will not be able to reply to you. If you do not give a valid email, we will not be able to reply to you. Send message Feedback We use cookies to give you the best experience on our website. By agreeing, you consent to our use of cookies and other analytics tools according to our privacy policy. No thanksI agree