使用 Hilbert 曲线可视化进行图形调试实践
联系方式 Kartik Agaram Freewheeling Apps 2025年1月31日
使用大量的 Hilbert 曲线可视化进行图形调试实践
“..你不是理解事物,你只是习惯它们。” — John von Neumann
一直以来 我都在倡导一种特定的编程风格:
- 使用不太频繁变化的工具。
- 使用不会无限期保留历史遗留问题的工具。
- 尽量减少活动部件。 避免额外的第三方库,并且完全放弃原生库。
Lua 和 LÖVE 一直是获得这些特性的一个好方法。 在我使用它们的过程中,我享受到了额外的好处:我可以随时在画布上进行绘制。 对于我过去保守且受终端限制的习惯来说,这是全新的体验,我一直在努力更多地依靠图形来理解我的程序在做什么。 在这里我想分享一个这样的经验。 我正在使用我的可随处运行的 Lua Carousel 应用程序,你可以将程序直接粘贴到其中,但该工作流程可以转移到任何带有画布的平台。
几周前,Jack Rusher 分享了一个令人困惑的函数来计算 Hilbert curve。 这是翻译成 Lua 的代码:
function h(x, y, xi, yi, xj, yj, n)
 if n <= 0 then
  return {x+xi/2+xj/2, y+yi/2+yj/2}
 end
 return array_join(
  h(x, y, xj/2, yj/2, xi/2, yi/2, n-1),
  h(x+xi/2, y+yi/2, xi/2, yi/2, xj/2, yj/2, n-1),
  h(x+xi/2+xj/2, y+yi/2+yj/2, xi/2, yi/2, xj/2, yj/2, n-1),
  h(x+xi/2+xj, y+yi/2+yj, -xj/2, -yj/2, -xi/2, -yi/2, n-1))
end
当我第一次看到它时,我可以看到一些表面的事实:
- 它返回一个包含
x和y坐标的点数组。 - 它是递归的。 有一个用于“叶”调用的基本情况,每个非基本情况进行 4 个递归调用。
- 只有基本情况实际上通过将点添加到结果来“绘制”。
- 非叶调用递归地将给定的正方形划分为 4 个象限。 正方形大小(xi/yi/xj/yj)每次都被减半。
但细节仍然不清楚。 为什么有交换/旋转? 为什么在四个象限之一中有负号? 寻找答案使我进行了多次迭代和一些图形基础设施,这些基础设施有望帮助我完成下一个调试任务。
v1: 首先要看的是曲线本身。
 代码
代码
function h(x, y, xi, yi, xj, yj, n)
 if n <= 0 then
  return {x+xi/2+xj/2, y+yi/2+yj/2}
 end
 return array_join(
  h(x, y, xj/2, yj/2, xi/2, yi/2, n-1),
  h(x+xi/2, y+yi/2, xi/2, yi/2, xj/2, yj/2, n-1),
  h(x+xi/2+xj/2, y+yi/2+yj/2, xi/2, yi/2, xj/2, yj/2, n-1),
  h(x+xi/2+xj, y+yi/2+yj, -xj/2, -yj/2, -xi/2, -yi/2, n-1))
end
function array_join(...)
 local result = {}
 for i, arg in ipairs{...} do
  for _,x in ipairs(arg) do
   table.insert(result, x)
  end end
 return result
end

local pts = h(60, 60, 800, 0, 0, 800, 5)
function car.draw()
 color(0,0,1)
 line(unpack(pts))
end
这使用了一些来自 Lua Carousel 的缩写。 我们保存点列表并将其绘制为 polyline。
比较 Wikipedia 上基于 L-system 的实现:
代码
function lsys(s)
 local result = {}
 for i=1,#s do
  local c = s:sub(i,i)
  if c == 'A' then
   table.insert(result, '+BF-AFA-FB+')
  elseif c == 'B' then
   table.insert(result, '-AF+BFB+FA-')
  else
   table.insert(result, c)
  end
 end
 return table.concat(result)
end
function draw_lsys(s)
 for i=1,#s do
  local c = s:sub(i,i)
  if c == 'F' then
   forward()
  elseif c == '+' then
   left()
  elseif c == '-' then
   right()
  end end end
function forward()
 local x2 = x+dirx*n
 local y2 = y+diry*n
 line(x,y, x2,y2)
 x,y = x2,y2
end
function left()
 if dirx == 0 then
  dirx = diry
  diry = 0
 else
  diry = -dirx
  dirx = 0
 end end
function right()
 if dirx == 0 then
  dirx = -diry
  diry = 0
 else
  diry = dirx
  dirx = 0
 end end
x,y = 100,100
dirx,diry = 0,1
n = 10
g.setLineWidth(3)
color(1,0,1, 0.1)
s = 'A'
for _ = 1,5 do
 s = lsys(s)
end
draw_lsys(s)
没有任何共同之处! 它是如何工作的? v2: 打印出 Jack 程序中的调用序列。 代码
function h(x, y, xi, yi, xj, yj, n)
 print(x,y, xi,yi, xj,yj)
 if n <= 0 then
  return {{x=x+xi/2+xj/2, y=y+yi/2+yj/2}}
 end
 return array_join(
  h(x, y, xj/2, yj/2, xi/2, yi/2, n-1),
  h(x+xi/2, y+yi/2, xi/2, yi/2, xj/2, yj/2, n-1),
  h(x+xi/2+xj/2, y+yi/2+yj/2, xi/2, yi/2, xj/2, yj/2, n-1),
  h(x+xi/2+xj, y+yi/2+yj, -xj/2, -yj/2, -xi/2, -yi/2, n-1))
end
function array_join(...)
 local result = {}
 for i, arg in ipairs{...} do
  for _,x in ipairs(arg) do
   table.insert(result, x)
  end end
 return result
end
h(0,0, 800,0, 0,800, 2)
为了保持输出的可管理性,我们将只查看二阶 Hilbert 曲线(因此最终的 n 输入为 2)。
运行此代码会产生以下输出。
60   60   800   0    0    800
60   60   0    400   400   0
60   60   200   0    0    200
60   260   0    200   200   0
260   260   0    200   200   0
460   260   -200  -0   -0   -200
460   60   400   0    0    400
460   60   0    200   200   0
660   60   200   0    0    200
660   260   200   0    0    200
660   460   -0   -200  -200  -0
460   460   400   0    0    400
460   460   0    200   200   0
660   460   200   0    0    200
660   660   200   0    0    200
660   860   -0   -200  -200  -0
460   860   -0   -400  -400  -0
460   860   -200  -0   -0   -200
460   660   -0   -200  -200  -0
260   660   -0   -200  -200  -0
60   660   200   0    0    200
看到这些,一些事实很清楚,而不需要 太 多的思考:
xi/yi和xj/yj是轴对齐的。 每对中总有一个为0。- 每对
xi/xj和yi/yj中只有一个为0。 这解释了为什么上面的代码有时会同时添加两者。
但是除了有节奏地除以 2 之外,这些 xi,yi,xj,yj 参数意味着什么? 仍然不清楚。
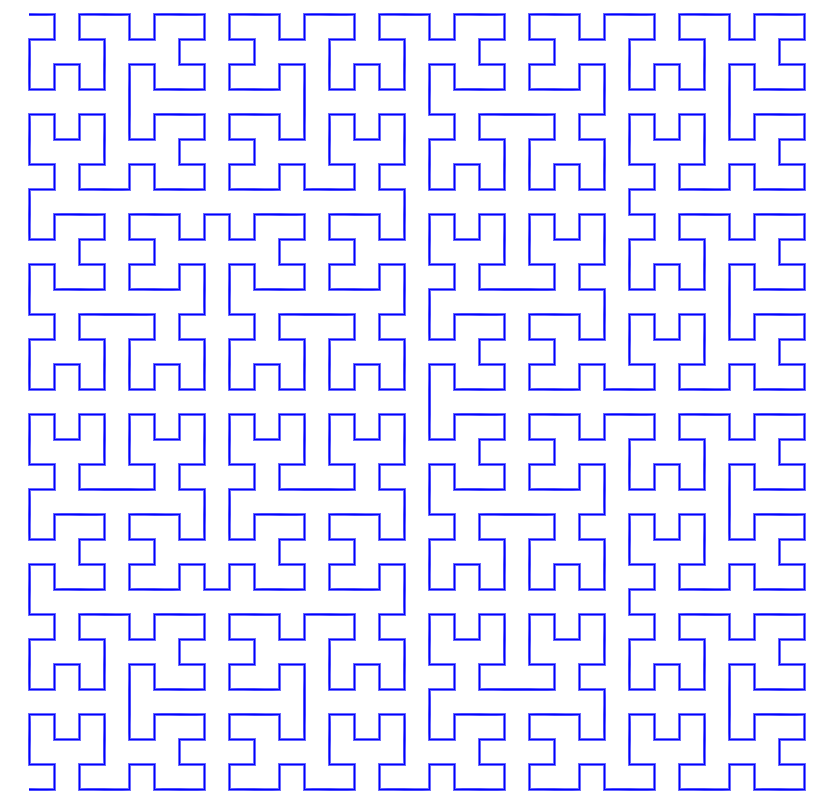
v3: 让我们看看 Jack 的原始动画。
一个 4 阶的 Hilbert 曲线在一个正方形区域内蜿蜒穿行,一个接一个地填充象限,并在每个象限内一个接一个地填充子象限。
代码
function h(x, y, xi, yi, xj, yj, n)
 if n <= 0 then
  return {{x=x+xi/2+xj/2, y=y+yi/2+yj/2}}
 end
 return array_join(
  h(x, y, xj/2, yj/2, xi/2, yi/2, n-1),
  h(x+xi/2, y+yi/2, xi/2, yi/2, xj/2, yj/2, n-1),
  h(x+xi/2+xj/2, y+yi/2+yj/2, xi/2, yi/2, xj/2, yj/2, n-1),
  h(x+xi/2+xj, y+yi/2+yj, -xj/2, -yj/2, -xi/2, -yi/2, n-1))
end
function array_join(...)
 local result = {}
 for i, arg in ipairs{...} do
  for _,x in ipairs(arg) do
   table.insert(result, x)
  end end
 return result
end
local pts = h(60, 60, 800, 0, 0, 800, 5)
local curr_index = 0
local speed = 100
function car.draw()
 color(0,0,0)
 for i=2,curr_index do
  color(0,0,0)
  line(pts[i-1].x, pts[i-1].y, pts[i].x, pts[i].y)
 end
end

function car.update(dt)
 curr_index = curr_index + dt*speed
 if curr_index > #pts then curr_index = #pts end
end
它显示了计算叶调用的顺序,但是该路径非常复杂。
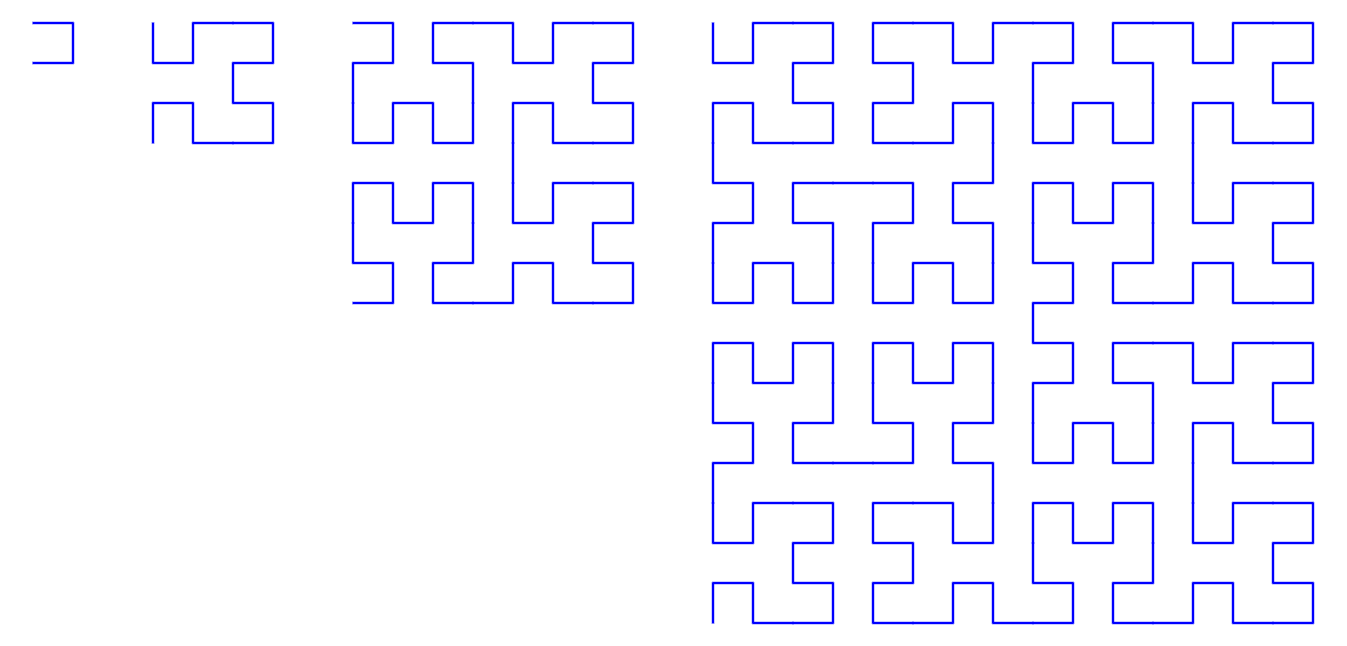
v4: 也许将几个迭代放在彼此旁边会有所帮助。
 代码
代码
function h(x, y, xi, yi, xj, yj, n)
 if n <= 0 then
  return {{x=x+xi/2+xj/2, y=y+yi/2+yj/2}}
 end
 return array_join(
  h(x, y, xj/2, yj/2, xi/2, yi/2, n-1),
  h(x+xi/2, y+yi/2, xi/2, yi/2, xj/2, yj/2, n-1),
  h(x+xi/2+xj/2, y+yi/2+yj/2, xi/2, yi/2, xj/2, yj/2, n-1),
  h(x+xi/2+xj, y+yi/2+yj, -xj/2, -yj/2, -xi/2, -yi/2, n-1))
end
function initialize_curves()
 local pts = {}
 local side = 80
 local x, y = 60, 60
 for n=1,4 do
  table.insert(pts, h(x,y, side,0, 0,side, n))
  x = x + side + 40
  side = side*2
 end
 return pts
end
local pts = initialize_curves()
function car.draw()
 color(0,0,1)
 for _, pts in ipairs(pts) do
  draw_lines(pts)
 end end
function draw_lines(pts)
 for i=2,#pts do
  line(pts[i-1].x, pts[i-1].y, pts[i].x, pts[i].y)
 end end
嗯,没那么多。 尤其是有助于查看第一次迭代。 4 个调用产生 4 个点,这些点串在一起形成 3 行,这些行并没有完全构成一个正方形。 但除此之外,它仍然很模糊。
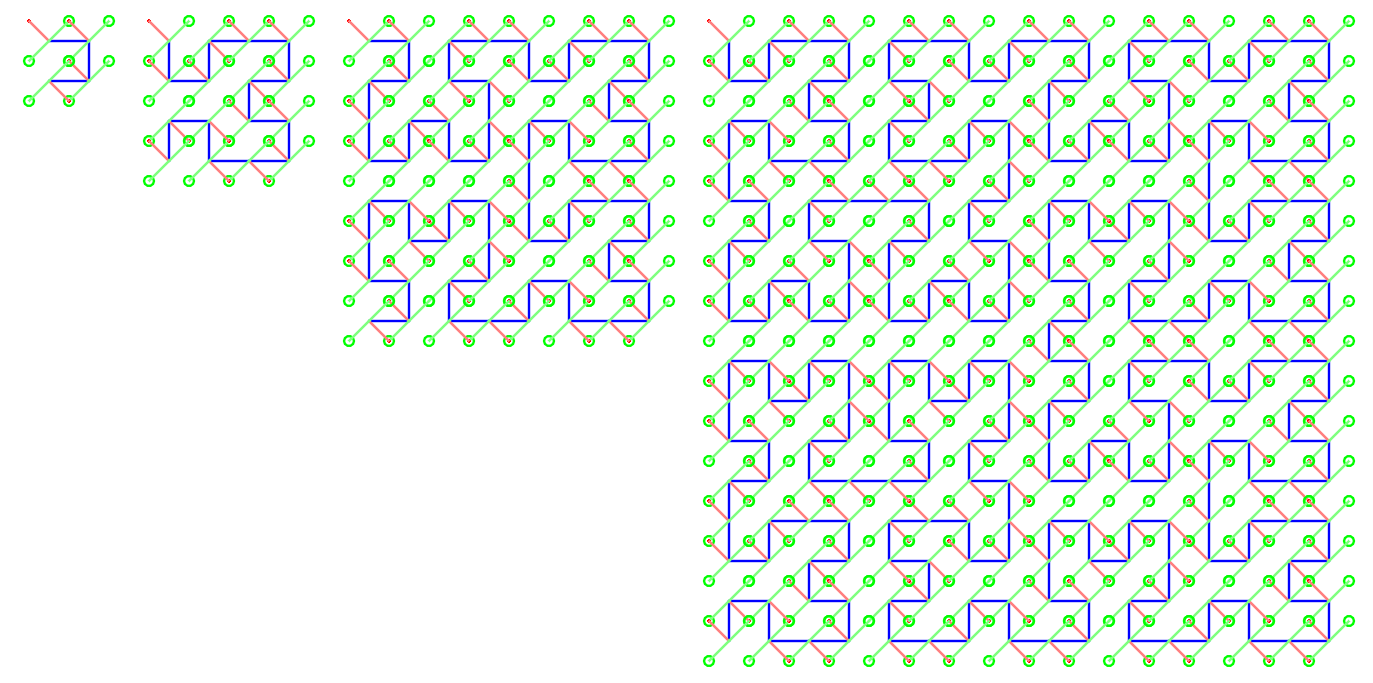
v5: 正如我所说,只有叶调用实际上添加了任何点。 如果我们显示更多关于它们的信息呢? 每个叶调用使用 3 个点,以将一个点添加到结果中。
 代码
代码
function h(x, y, xi, yi, xj, yj, n)
 if n <= 0 then
  local resultx, resulty = x+xi/2+xj/2, y+yi/2+yj/2
  local x3, y3 = x+xi, y+yi
  local x4, y4 = x+xj, y+yj
  local debug = {
   {type='circle', drawmode='fill', x=x, y=y, radius=2, r=1,g=0,b=0},
   {type='line', x1=resultx, y1=resulty, x2=x, y2=y, r=1,g=0.5,b=0.5},
   {type='circle', drawmode='line', x=x3, y=y3, radius=5, r=0, g=1, b=0},
   {type='line', x1=resultx, y1=resulty, x2=x3, y2=y3, r=0.5,g=1,b=0.5},
   {type='circle', drawmode='line', x=x4, y=y4, radius=5, r=0, g=1, b=0},
   {type='line', x1=resultx, y1=resulty, x2=x4, y2=y4, r=0.5,g=1,b=0.5},
  }
  return {{x = resultx, y = resulty, draw=debug}}
 end
 return array_join(
  h(x, y, xj/2, yj/2, xi/2, yi/2, n-1),
  h(x+xi/2, y+yi/2, xi/2, yi/2, xj/2, yj/2, n-1),
  h(x+xi/2+xj/2, y+yi/2+yj/2, xi/2, yi/2, xj/2, yj/2, n-1),
  h(x+xi/2+xj, y+yi/2+yj, -xj/2, -yj/2, -xi/2, -yi/2, n-1))
end
function array_join(...)
 local result = {}
 for i, arg in ipairs{...} do
  for _,x in ipairs(arg) do
   table.insert(result, x)
  end end
 return result
end
function initialize_curves()
 local pts = {}
 local side = 80
 local x, y = 60, 60
 for n=1,4 do
  table.insert(pts, h(x,y, side,0, 0,side, n))
  x = x + side + 40
  side = side*2
 end
 return pts
end
local pts = initialize_curves()
function draw_hilbert(pts)
 color(0,0,1)
  g.setLineWidth(2)
 for i=2,#pts do
  line(pts[i-1].x, pts[i-1].y, pts[i].x, pts[i].y)
 end
 for _, pt in ipairs(pts) do
  if pt.draw then
   for _,shape in ipairs(pt.draw) do
    color(shape.r, shape.g, shape.b, shape.a)
    if shape.type == 'circle' then
     circle(shape.drawmode, shape.x, shape.y, shape.radius)
    elseif shape.type == 'line' then
     line(shape.x1, shape.y1, shape.x2, shape.y2)
    end end end end
end
function car.draw()
 for _, pts in ipairs(pts) do
  draw_hilbert(pts)
 end end
这很漂亮。 现在每个点都可以包含一堆调试数据,用于绘制其他形状的命令。 由于 xi,yi,xj,yj 都是距离而不是位置,因此我正在绘制(x+xi,y+yi)和(x+xj,y+yj),并且很明显这 3 个点如何协作以形成 Hilbert 曲线上的每个点。 显然,控制点始终是西北到东南方向,沿着东北到西南方向(红线)转换基点(x,y)。
但是除了该方向之外,还有什么模式? 这里还有更多的东西要挖掘。
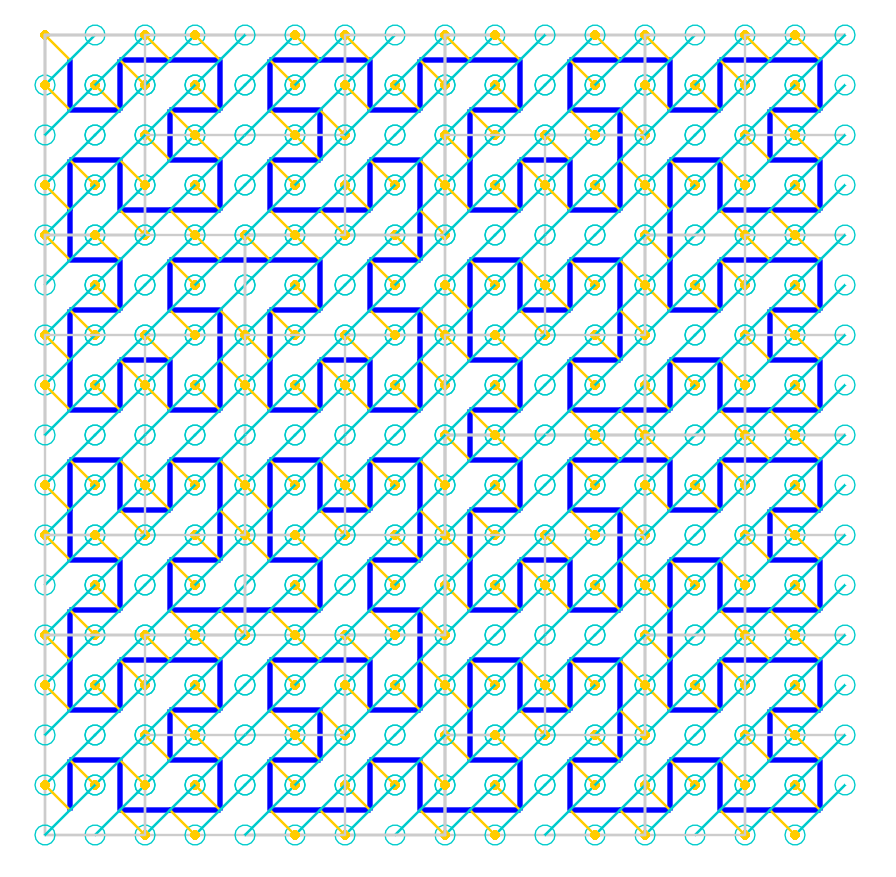
v6: 也许查看脚手架会有所帮助。 不要告诉我这三个点如何形成第四个点,而是告诉我每个递归调用的“包络”。
 代码
代码
local ox,oy = 300,100 -- where to start drawing
local N = 800 -- size of the drawing
local depth = 4 -- levels of recursion; 0 = single point
-- colors
local primary = {r=1, g=0.8, b=0}
local control = {r=0, g=0.8, b=0.8}
local c = 0.8
local scaffold = {r=c, g=c, b=c}
function h(x, y, xi, yi, xj, yj, n, N)
 if N == nil then N = n end
 local x3, y3 = x+xi, y+yi
 local x4, y4 = x+xj, y+yj
 if n <= 0 then
 local resultx, resulty = x+xi/2+yi/2, y+yi/2+yj/2
 local debug = {
  {type='circle', drawmode='fill', x=x, y=y, radius=5, color=primary},
  {type='line', x1=resultx, y1=resulty, x2=x, y2=y, color=primary},
  {type='circle', drawmode='line', x=x3, y=y3, radius=10, color=control},
  {type='line', x1=resultx, y1=resulty, x2=x3, y2=y3, color=control},
  {type='circle', drawmode='line', x=x4, y=y4, radius=10, color=control},
  {type='line', x1=resultx, y1=resulty, x2=x4, y2=y4, color=control},
 }
  return {{x = resultx, y = resulty, draw=debug}}
 end
 local result = array_join(
  h(x, y, xj/2, yj/2, xi/2, yi/2, n-1, N),
  h(x+xi/2, y+yi/2, xi/2, yi/2, xj/2, yj/2, n-1, N),
  h(x+xi/2+xj/2, y+yi/2+yj/2, xi/2, yi/2, xj/2, yj/2, n-1, N),
  h(x+xi/2+xj, y+yi/2+yj, -xj/2, -yj/2, -xi/2, -yi/2, n-1, N))
 if result[1].draw == nil then result[1].draw = {} end
 result[1].draw = array_join(result[1].draw, {
   {type='line', x1=x, y1=y, x2=x3, y2=y3, color=scaffold},
   {type='line', x1=x, y1=y, x2=x4, y2=y4, color=scaffold},
 })
 return result
end
function car.draw()
 local pts = h(0,0, N,0, 0,N, depth)
 color(0,0,1)
 love.graphics.setLineWidth(5)
 for i=2,#pts do
   line(ox+pts[i-1].x, oy+pts[i-1].y, ox+pts[i].x, oy+pts[i].y)
 end
 for _, pt in ipairs(pts) do
  if pt.draw then
   for _,shape in ipairs(pt.draw) do
    color(shape.color.r, shape.color.g, shape.color.b, shape.color.a)
    if shape.type == 'circle' then
     love.graphics.setLineWidth(1)
     circle(shape.drawmode, ox+shape.x, oy+shape.y, shape.radius)
    elseif shape.type == 'line' then
     love.graphics.setLineWidth(2)
     line(ox+shape.x1, oy+shape.y1, ox+shape.x2, oy+shape.y2)
    end end end end end
function array_join(...)
 local result = {}
 for i, arg in ipairs{...} do
  for _,x in ipairs(arg) do
   table.insert(result, x)
  end end
 return result
end
不,那很漂亮,但是太乱了。 计算已分区,但是图像充满了重叠的点和线(尽管我努力使用填充的和空心的圆圈在一个地方显示两件事)。 我们如何揭示重叠? 也许是一些动画? 4 阶 Hilbert 曲线如前所述绘制,带有 3 个控制点和灰色脚手架直线。 灰色线条略微来回旋转,以更好地显示上述图像中多个线条重叠的位置。 | Hilbert 曲线 2 阶如前所述绘制,灰色线条略微来回旋转。 比 4 阶曲线不那么繁忙。 ---|--- 代码
local ox,oy = 300,100 -- where to start drawing
local N = 800 -- size of the drawing
local depth = 4 -- levels of recursion; 0 = single point
local d = 0 -- instantaneous offset of the corner of the scaffold
local dmax = 10
local ddd = 10 -- how fast the corner of the scaffold moves
local dd = ddd -- instantaneous speed of the corner of the scaffold
-- colors
local primary = {r=1, g=0.8, b=0}
local control = {r=0, g=0.8, b=0.8}
local c = 0.8
local scaffold = {r=c, g=c, b=c}
function h(x, y, xi, yi, xj, yj, n, N)
 if N == nil then N = n end
 local x3, y3 = x+xi, y+yi
 local x4, y4 = x+xj, y+yj
 if n <= 0 then
 local resultx, resulty = x+xi/2+yi/2, y+yi/2+yj/2
 local debug = {
  {type='circle', drawmode='fill', x=x, y=y, radius=5, color=primary},
  {type='line', x1=resultx, y1=resulty, x2=x, y2=y, color=primary},
  {type='circle', drawmode='line', x=x3, y=y3, radius=10, color=control},
  {type='line', x1=resultx, y1=resulty, x2=x3, y2=y3, color=control},
  {type='circle', drawmode='line', x=x4, y=y4, radius=10, color=control},
  {type='line', x1=resultx, y1=resulty, x2=x4, y2=y4, color=control},
 }
  return {{x = resultx, y = resulty, draw=debug}}
 end
 local result = array_join(
  h(x, y, xj/2, yj/2, xi/2, yi/2, n-1, N),
  h(x+xi/2, y+yi/2, xi/2, yi/2, xj/2, yj/2, n-1, N),
  h(x+xi/2+xj/2, y+yi/2+yj/2, xi/2, yi/2, xj/2, yj/2, n-1, N),
  h(x+xi/2+xj, y+yi/2+yj, -xj/2, -yj/2, -xi/2, -yi/2, n-1, N))
 -- i's and j's always share the same sign
 -- at least one of xi and yi is always non-zero
 local dir = (xi == 0) and sign(yi) or sign(xi)
 local xs, ys = x+(N-n)*d*dir, y+(N-n)*d*dir
 result[1].draw = array_join(result[1].draw, {
  {type='line', x1=xs, y1=ys, x2=x3, y2=y3, color=scaffold},
  {type='line', x1=xs, y1=ys, x2=x4, y2=y4, color=scaffold},
 })
 return result
end
function car.draw()
 local pts = h(0,0, N,0, 0,N, depth)
 color(0,0,1)
 love.graphics.setLineWidth(5)
 for i=2,#pts do
   line(ox+pts[i-1].x, oy+pts[i-1].y, ox+pts[i].x, oy+pts[i].y)
 end
 for _, pt in ipairs(pts) do
  if pt.draw then
   for _,shape in ipairs(pt.draw) do
    color(shape.color.r, shape.color.g, shape.color.b, shape.color.a)
    if shape.type == 'circle' then
     love.graphics.setLineWidth(1)
     circle(shape.drawmode, ox+shape.x, oy+shape.y, shape.radius)
    elseif shape.type == 'line' then
     love.graphics.setLineWidth(2)
     line(ox+shape.x1, oy+shape.y1, ox+shape.x2, oy+shape.y2)
    end end end end end
function car.update(dt)
 d = d+dd*dt
 if d >= dmax then
  d, dd = dmax, -ddd
 elseif d < 0 then
  d, dd = 0, ddd
 end end
function array_join(...)
 local result = {}
 for i, arg in ipairs{...} do
  for _,x in ipairs(arg) do
   table.insert(result, x)
  end end
 return result
end
function sign(a)
 if a > 0 then return 1
 elseif a < 0 then return -1
 else return 0
 end
end
再说一次,很漂亮。 但是太繁忙了; 我不确定盯着它我能学到什么。
此时,我开始对已经创建的这个程序的许多不同版本感到不知所措。 它们还在争夺与干净的 Hilbert 曲线的空间,并且我发现自己正在注释和取消注释代码,以便在曲线及其内部之间来回切换。 我意识到我可以为调试 UI 创建一个专用空间,同时还可以提取一些调试 UI 的常见模式,这些模式可能对其他程序有用。
专用空间可以是 一个古怪的小窗口管理器。 但是 Carousel 有其自己的同名隐喻,用于为程序提供自己的专用空间/屏幕,即使在手机的小屏幕上,你也可以使用沿左右边距的按钮进行导航。 让我们为每个调试 UI 提供自己的屏幕。 程序在名为 Windows 的表中的一个特殊键下为特定 UI 编写数据,现在其他屏幕中的调试 UI 可以渲染它们在那里找到的内容。
一些模式开始成为焦点:
- 文本日志。 这很简单,不需要自己的屏幕。 它是泛化的起点。 我在上面的
v2中找到了它。 - 回放日志。 程序将形状组附加到日志中,并且它们以附加到日志中的相同顺序随时间显示。 实际上,我们只是将时间显示为时间,只是偏移了,这是一个具有可调速度的录音。 这类似于上面的
v3。 代码 (150 行)
-- Debug window with a pannable, zoomable, infinite 2D surface that plays groups of vector commands
-- in a loop.
-- Groups cumulate; frame 2 draws shapes from groups 1 and 2, and so on.
run_screen('ticks')
run_screen('widgets')
function debug_window_replay_log(window_name, speeds)
local I = {}
if Windows == nil then Windows = {} end
if Windows.__viewport == nil then Windows.__viewport = {} end
if Windows[window_name] == nil then Windows[window_name] = {} end
-- Windows.__viewport[window_name] = nil -- uncomment to reset viewport
if Windows.__viewport[window_name] == nil then
 run_screen('infinite-viewport')
 Windows.__viewport[window_name] = run_screen_return
 run_screen_return = nil
end
local v = Windows.__viewport[window_name]
local frame_index = 0
local speed_index = 1
for i,speed in ipairs(speeds) do
 if speed == 1 then speed_index = i end
end
function car.draw()
 local title = ('%d/%d'):format(frame_index, #Windows[window_name])
 love.graphics.print(title, 100, Menu_bottom + 15)
 I.draw_axes()
 assert(frame_index < #Windows[window_name]+1)
 for i=1,frame_index do
  local shape_batch = Windows[window_name][i]
  I.draw_shapes(shape_batch)
 end
 -- stuff in viewport coordinates
 love.graphics.setColor(0.5,0.5,0.5)
 love.graphics.print('replay speed (shapes/s)', 50, 250-